I would like to stress, you only need to understand these two patterns, and their associated BUY and SELL signals for this system to work.
I am looking for two common patterns in the S&P500 (C Fund) that occur over months, not daily up and down fluctuations. An up pattern: Pattern 1 and a down pattern: Pattern 2. Once you learn to spot these patterns, you start to say…oh yeah…I see it. I visualize and track the S&P500 (=C fund) in Yahoo Finance.
Pattern 1 The Rise: An upturn from the bottom of pattern 2 begins with the BUY signal. The S&P500 rises fairly rapidly through the 20DMA and the 50DMA and then hiting the upper Bollinger band, followed by a steady sustained rise mostly above the 20DMA.
Pattern 1 is usually longer than pattern 2, often a number of months, and more sustained, with lower daily volatility. Steadily ratcheting up and down on a daily basis, churning up. Pattern 1 often starts out strong, rises up and rides the upper Bollinger Band for a while. Towards the end of pattern 1, it starts to get “mushy”, less vigorous, often with increased daily volatility.
There may be days in Pattern 1 which may dip slightly below the 20DMA but recover, with no evidence of a strong sell signal. I call that a test of the 20DMA. Professional Traders take note of this test. If it holds, they hold. If it punches through, they sell. It becomes self fulfilling and the S&P 500 continues to drop.
When we are in a slow sustained rising Pattern 1, you chill out, but keep one eye open on daily market activity.
Pattern 2: The Drop. The beginning of Pattern 2 (the SELL signal) is less well defined than the beginning of pattern 1 (the BUY signal). A punch through the 20DMA going down, which defines the SELL signal, crossing the 20DMA, often dropping significantly for 3 out of 5 days, often crashing below the 50DMA. followed by high up and down daily volatility. Traders around the world use the 20DMA as a support level. If it drops significantly below the 20DMA, traders sell, and the drop becomes self fulfilling and the momentum turns downward.
Pattern 2 generally continues below the 20DMA.
Pattern 2 is usually shorter, more abrupt with higher volatility (daily swings) than pattern 1. If you are in Pattern 2 and are below the 50DMA and it is going down, wait to get back into the C fund until you get a clear BUY signal. Be cautious, be actively monitoring market activity when it is below the 50DMA.
Pattern 2 is what can continue to cascade downward into a correction or a crash, but not that often. If you are particularly skittish, you can wait to get into C well after the BUY signal, just to see if it is a strong rise. It is the BUY signal at the bottom of Pattern 2, usually below the 50DMA, that is an opportunity to make money.
The Pattern 2 drop is often characterized by the well known Dead Cat Bounce (info: 1, 2, 3) also known as a “Suckers bounce”. That is, one, or two, or even three false recoveries, followed by a true bottom and a strong Buy signal. This if often recognized after the fact. The trick is to not get back in too soon at the first or second false recovery.
These patterns and the BUY and SELL signals are not perfect and each one varies a bit. You can find examples of Pattern 1 & 2 with BUY and SELL signals here.
Extra Credit Homework: Go back in time on the Yahoo S&P 500 Chart by dragging it, and look for examples of Patterns 1 & 2 and of BUY and SELL signals. Notice that when the SMI bottoms out and turns up (below the black midline) (the SELL signal) it is often followed by a rise in the S&P500 index.
Here is a typical example of the BUY signal: 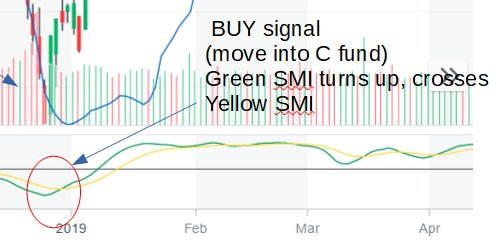 You will learn more about this later:
Here is a typical example of a SELL signal. 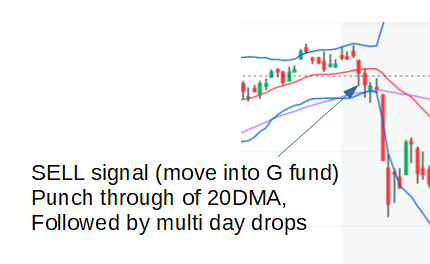 You will learn more about this later.
Back to Home