At the beginning of Pattern 1 there is a BUY signal which initiates pattern 1. This is where you get into the C fund.
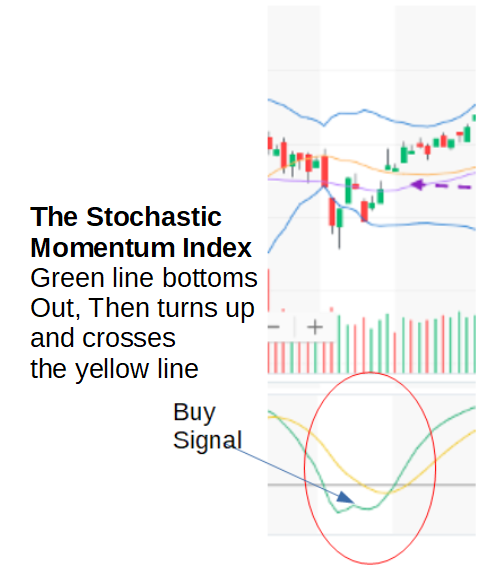
It comes after a significant drop in the S&P500 has lost it’s steam. The BUY signal defines a dip. uses the Stochastic Momentum Index found under the Yahoo S&P500 chart (if you set it up right). It is where the green line turns up and in a few days crosses the yellow line on its way up. Typically this happens at or below the black midline of the SMI. These occur when the S&P500 is well below the 20DMA and often below the 50DMA.
I only use the SMI as a BUY signal to help define a bottom. I ignore the SMI when the market is in a rise above the 20DMA and the SMI is above the 0 midline on the SMI chart indicator. I do not use the SMI as a sell signal.
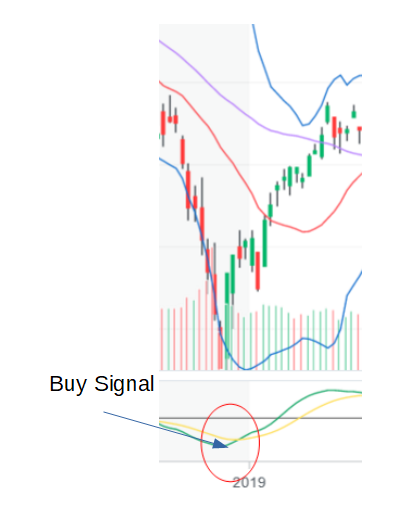


A typical Pattern 1 is strongly up early on with low volatility. Mostly up days, shooting up through the 50DMA and the 20DMA until it hits the upper Bollinger Band. Often it then rides up the Bollinger band above the 20DMA. Once it has shot up from the bottom and hit the upper Bollinger band, most of the happy stuff occurs above the 20DMA. This often continues until it starts to get “mushy”. It starts to get into an Up-Down phase, still ratcheting up overall. Often it may dip slightly below the 20DMA but not as much in a strong sustained way.
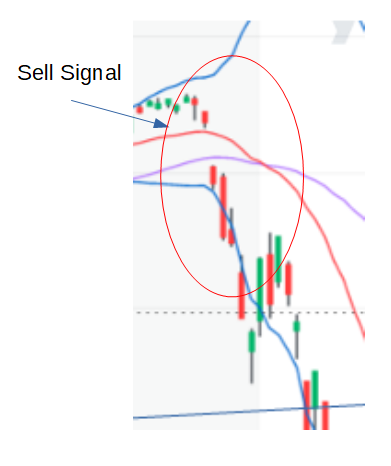
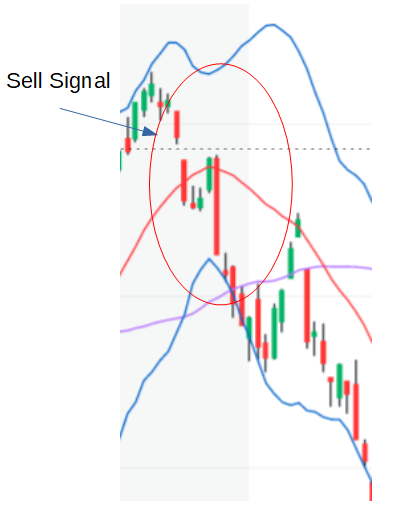
The SELL/STOP LOSS signal is less clear than the BUY signal, but it’s not that hard. As Pattern 1 peters out it degrades into the SELL signal initiating pattern 2 This is where it it punches down through the 20DMA and continues down, often with 3 down days over 5 days.
This 3 day rule is to distinguish a real drop from a simple test of the 20DMA.This is when you get into the G fund. Of course you lose a small percentage of profits, typically less than 5%, but you are trying to protect against a serious drop. Often you will make up that 5% and more in the next rise after a true BUY signal.
This 3 day drop often continues down into Pattern 2. This occurs on the chart itself. Many times there are two to three false recoveries (dead cat bounce) in pattern 2 before it hits a true bottom. Don’t be too quick to get back into the C fund until there is a true BUY signal.


Back to Home